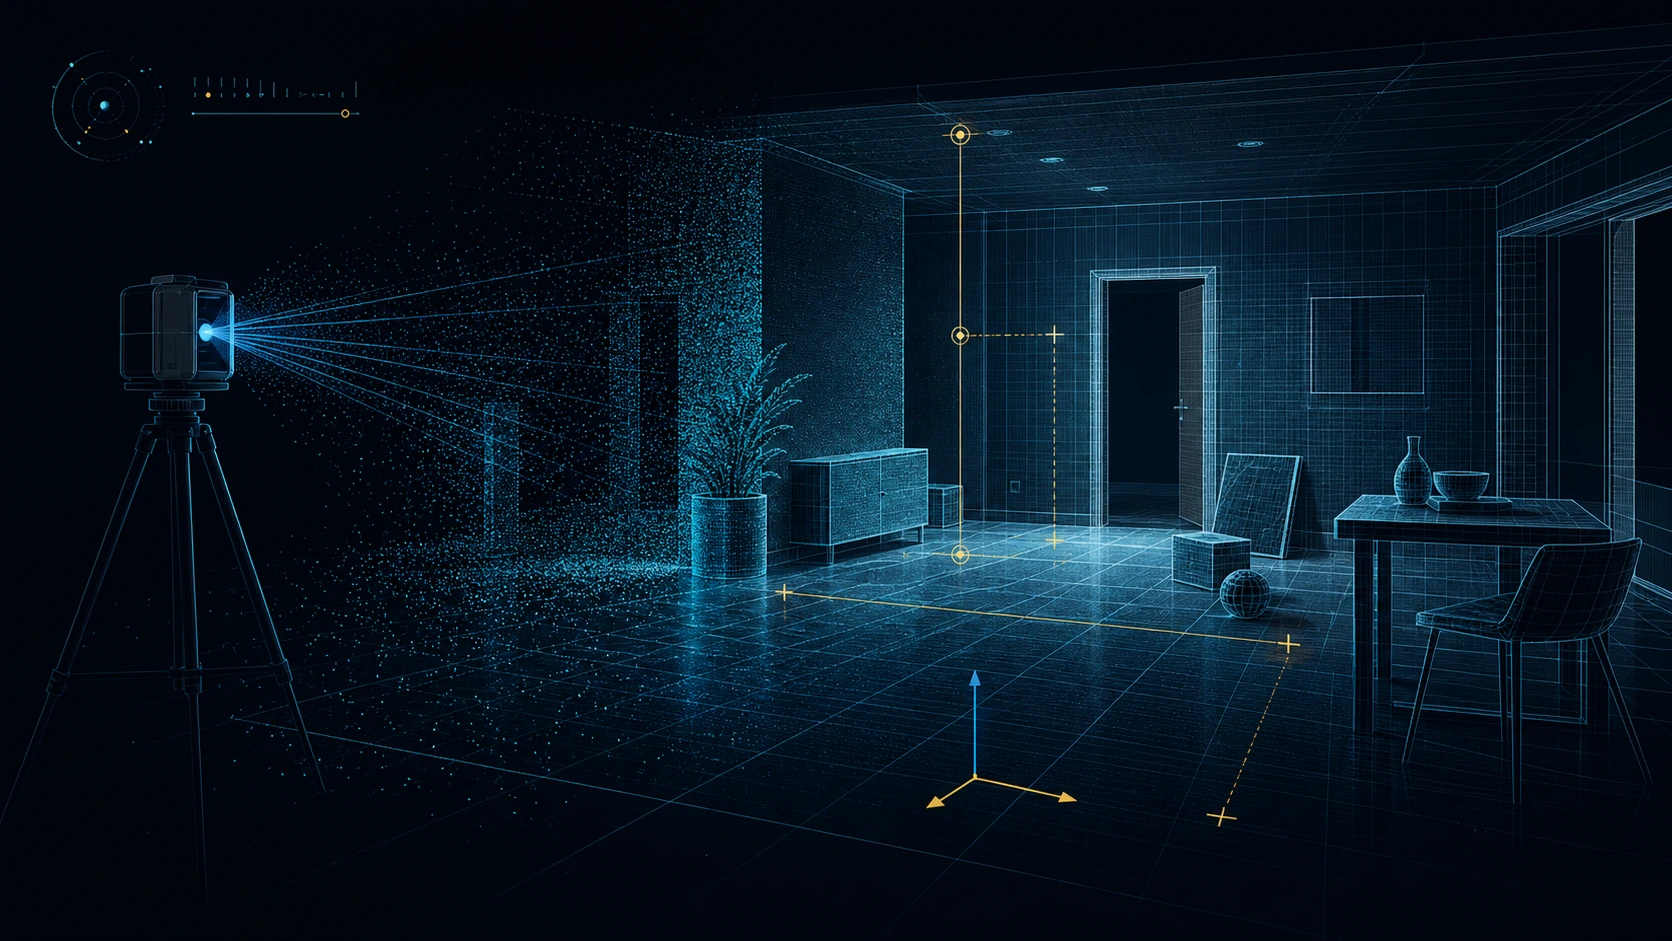
What a point cloud is
A point cloud is a set of millions of points with X, Y, Z coordinates that, together, reproduce the real shape of an object, a building or a terrain. Each point is a measurement: the exact place in space where the scanner or camera detected a surface. From a distance, the cloud looks like a 3D photograph; up close, you can see it is made of individual points.
The key is that you can measure on it: distances, heights, sections, areas, volumes. That is why it is the starting point for existing-condition drawings, an as-built BIM model or a digital twin.
What each point stores
- X, Y, Z coordinates. In a local or georeferenced system (in Spain, ETRS89 / UTM).
- Colour (RGB). Taken from the scanner’s or camera’s photographs.
- Intensity. The strength of the returning laser; it tells materials apart even when they are the same colour.
- Class. Ground, vegetation, building, pipe… It is assigned when processing the cloud and lets you filter it.
- Other attributes: surface normal, return number in airborne LiDAR, timestamp.
How a point cloud is captured
| Method | How it measures | Best for |
|---|---|---|
| Terrestrial laser scanner | From a tripod, station by station | Interiors, building services, structure; maximum accuracy |
| SLAM (mobile scanner) | Walking, continuously | Long routes, tunnels, industrial buildings, heritage |
| Drone LiDAR | Laser from the air, with multiple returns | Terrain, beneath vegetation, linear works, large areas |
| Photogrammetry | Calculated from overlapping photos | Façades, roofs, quarries; excellent colour |
Most projects combine them: terrestrial laser inside, drone outside, all joined into a single cloud. Joining the captures is registration, and placing them in real coordinates is georeferencing. We explain it in detail in what is Scan to BIM.
There are also public clouds at national scale: the PNOA-LiDAR from Spain’s National Geographic Institute (Instituto Geográfico Nacional) covers Spain with low-density aerial clouds, useful for terrain studies, though not for measuring a building. We explain it in PNOA-LiDAR and its third coverage.
Accuracy, density and noise
Three words best kept separate when ordering or reviewing a cloud:
- Accuracy: how close each point is to its real position. With a terrestrial laser scanner, in the order of ±2 mm under controlled conditions; with a drone, centimetre-level.
- Density: how many points there are per area, or the spacing between points. More density shows more detail, but does not make the cloud more accurate.
- Noise: the scatter of points on a surface that should be smooth. SLAM has more than terrestrial laser; photogrammetry has more in textureless areas.
The figure that matters is not the one on the scanner’s data sheet, but that of the registered dataset. Always ask for the registration report with the error between stations and, if there is georeferencing, the fit to the control points.
Point cloud formats
- E57: the neutral 3D scanning format, standardised in ASTM E2807. It stores points, attributes and images. If you only ask for one, make it this.
- LAS / LAZ: the standard in surveying, GIS and airborne LiDAR; LAZ is its lossless compressed version.
- COPC: a LAZ organised by levels of detail, designed for opening huge clouds on the web without downloading them in full.
- RCP / RCS: the Autodesk ReCap format, the one linked into Revit and AutoCAD.
- PLY, PTS, PTX, XYZ: simple formats, useful for one-off exchanges.
What a point cloud is used for
- Measuring without going back to site: distances, heights, clearances, checking whether something fits.
- Existing-condition drawings: plans, sections and elevations extracted from the cloud.
- As-built BIM modelling: the model is built on the cloud, at the agreed LOD.
- Construction and deformation monitoring: comparing two clouds, or cloud against model, with colour maps.
- Volume measurements of stockpiles, quarries or earthworks.
- Digital twins and visualisation: as the measured-reality layer or as the base for photorealistic Gaussian Splatting.
A real example: on the Santillana Canal, for Canal de Isabel II, the continuous cloud of more than 12 km of conduits was the main deliverable for inspection and maintenance, without needing to model everything in BIM. We explain it in the full case study.
How to open and share it
A cloud is very heavy, so the practical way to share it is a web viewer: the team moves through it and measures from the browser without installing anything or downloading gigabytes. VisionHub opens clouds in E57, LAS, LAZ and COPC alongside the IFC model; on the desktop, CloudCompare or Leica TruView are free options. You have the full comparison in BIM and point cloud viewers.
If you need a point cloud of a building, a plant or a site, tell us what you are going to use it for: that determines which method, which density and which format suit you.